Tag Archives: analytics

Raising a Startup is easier when you have Data

You might thing that this statement is a given but you can’t imagine how many enthusiastic new managers enroll in creating and developing new business ideas only based on passions and personal hunches. in no way I’m saying that they are going to fail because doing What you love is a great bonus in a business but a more pragmatic approach would be recommended. Such way of doing things is based on facts, and facts are very hard to be obtained at the beginning of something new. This period is considered to be the most unstable because of all the possible directions and turn-arounds that can be made.

Continue reading

Data science automates love

Tinder App is nothing new for anybody since most of us slowly accepted it in our lives but it also brings some displeasure. For instance, this guy thought that it can automate the process in the way of an app that decides if you’d like a person and start a conversation.

Continue reading

Big Data and Data Mining Tools

Recently we have tested a Data Mining tool about which i want to write today. It is called Datameer and it’s a cloud app based on Hadoop so we don’t need to install anything on our computers but we must have the data that we want analyzed.

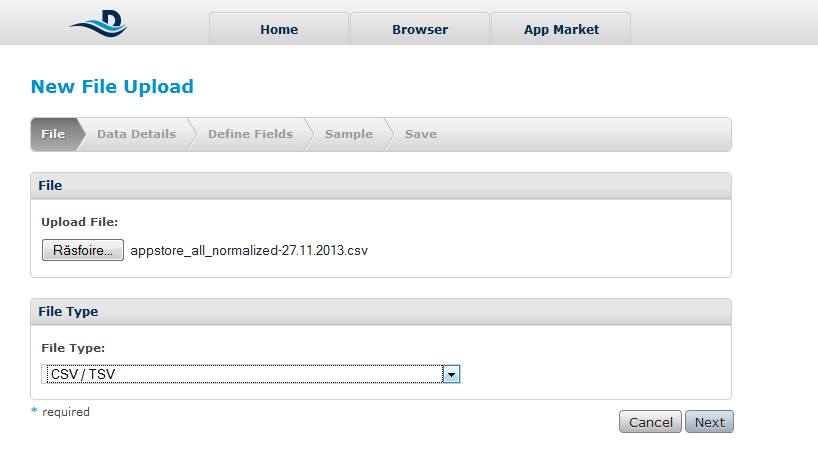
Step 1: Importing the data

To import any kind of data we must select the format of them:

datameer0

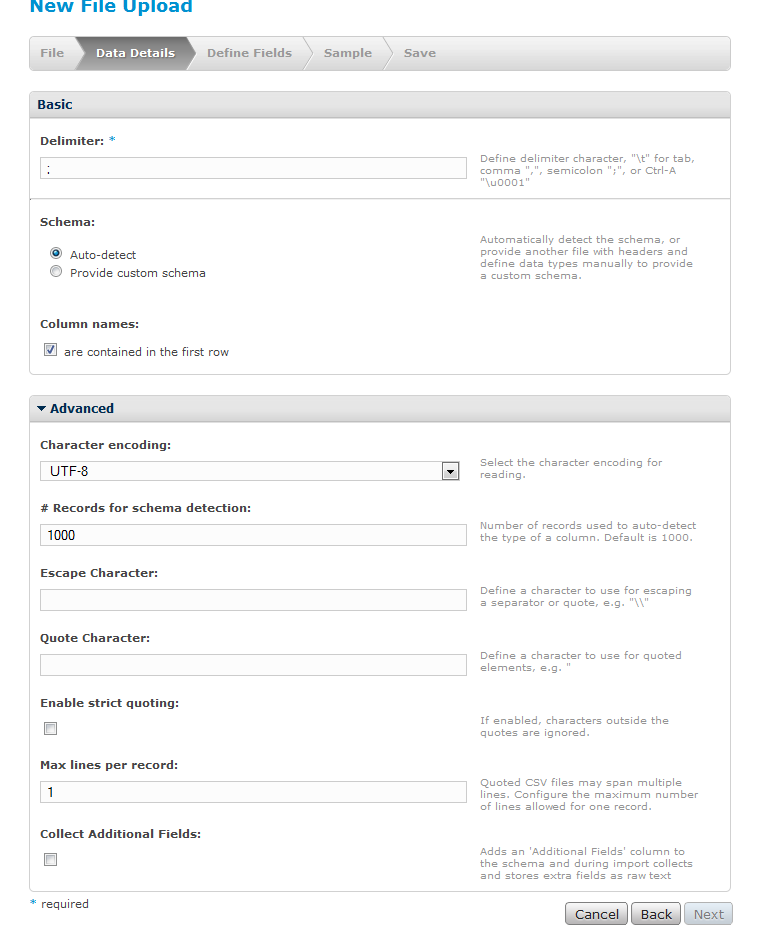
Step 2: A small configuration

Some of which regard data format, others of the way to detect certain data types. This program tries to detect each column’s type being possible to add data types from a file:

datameer0.1

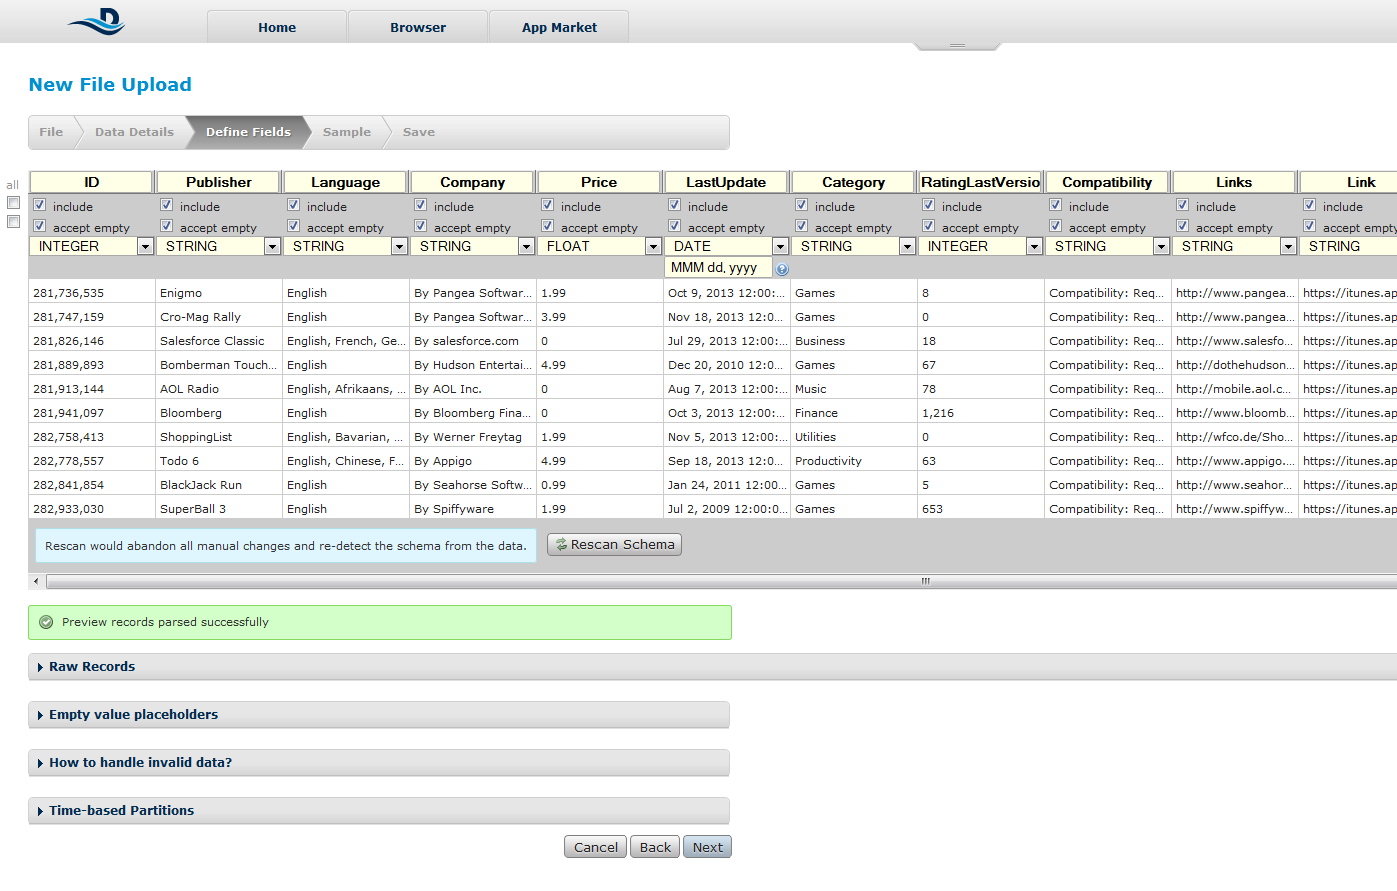
Step 3: Some fine adjustments
If the program doesn’t detect the columns well we can do it manually.  A bad of this program is the fact that we can adjust data at this step only by removing of the recordings that won’t correspond to the type of data recently defined.

datameer1

Step 4:Selecting the sample used for previsualisation

datameer2

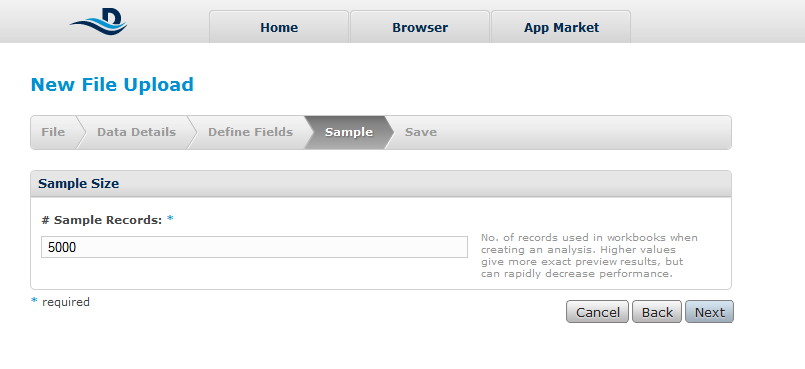
So this is all it is to be done for adding data into Datameer. Further on, an excel-like interface shows all the data .
Here we can find a few buttons responsible for the magic:

Column Dependency
Shows the relation between different columns and basically if a variable depend on other.

Clustering
Using this we can group similar data.
All the discovering part is done by the program and we only have to specify the number of clusters that we want.

Decision Tree
Builds a decision tree based on the data.

These are all the important function of Datameer, but the true importance of this App relies not on the functions but on the ability of processing a huge quantity of data/

Perspective Analytics is what really matters

I don’t know how much have you heard about Perspective Analytics because it is not as popular as Descriptive and Predictive Analytics but sure it has the power of changing how we treat Big Data.

By taking a blunt look at this situation we can say that Perspective Analytics is the new term to name the step from analytics to knowledge in the data to knowledge pyramid. Predictive analytics is the next step up in data reduction. It utilizes a variety of statistical, modeling, data mining, and machine learning techniques to study recent and historical data, thereby allowing analysts to make predictions about the future. As we know, big data imposes a huge amount of information the majority of which is useless, hence the necessity for this new service.

The purpose of analytics is not to tell you what is going to happen in the future but, because of its probabilistic nature, to inform you of what MIGHT happen, based on a a predictive model with two additional components: actionable data and a feedback system that tracks the outcome produced by the action taken.

This type new step/ type of analytics was first introduced in 2013 after the Descriptive Analytics was defined as the simplest class of analytics, one that allows you to condense big data into smaller, more useful nuggets of information, after which next step in reducing information is by applying a Predictive algorithm.

IBM’s vision is that descriptive analytics allows an understanding of what has happened, while advanced analytics, consisting of both predictive and prescriptive analytics, is where there is real impact on the decisions made by businesses every day


The science behind an internet request

Altruism can be found in many shapes on the internet, especially on sites designed for user interaction, like blogs, forums or social networks. The giant Reddit even has a special thread The random acts, on Pizza section which is specialized in giving free pizza to strangers if the story they tell is worth one. It is fun and the motto is as simple as that: “because … who doesn’t like helping out a stranger? The purpose is to have fun, eat pizza and help each other out. Together, we aim to restore faith in humanity, one slice at a time.”

This great opportunity rises an objective popular question in our minds though: What should one say to get free pizza, and furthermore, what should one say to get any kind of free stuff on the internet? A possible answer comes once again from the science of data mining. Researchers at Stanford University analyzed this intriguing problem but limited to Reddit posts.

By mining all the section posts from 2010 until today and passing them through filters like sentiment analysis, politeness and more important if they wore successful or not, a pattern was established.Altruism I

Predictability rate resulted is up to 70 % accuracy and beside the sociological observations, like the positive results of longer posts or the negative results of very polite posts it is interesting to observe the algorithm that made all this possible by dividing the narratives into five types, those that mention: money; a job; being a student; family; and a final group that includes mentions of friends, being drunk, celebrating and so on, which the team  called “craving.”

This study has a very important role in analytics of behavior of peers on the internet and opens a wide area of research for better understanding of online consumers around the world.


Challenging users to data science

A problem well known in the data science world is the mismatch between people who have the data and people who know how to use it. On the other hand data scientists complain about the difficulties of the scrapping process and more exact, the difficulties of obtaining the data. For this mismatch Kaggle was created, trying to mediate a connection between data and analysts.

The platform was born on this principles and creates a competition between users which must update solutions to diverse data sets and so to win points, and, in the end, money.

On the other side, the uploader of data gets a number of possible solutions of analysis to his data sets, from which he can choose the most appropriate to his interests.

A very interesting case study, and a powerful demonstration in favor of Kaggle capabilities is the collaboration that the platform has, with NASA and Royal Astronomical Society, in which the challenge was to find an algorithm for measuring the distortions in images of galaxies in order for scientists to prove the existence of dark matter. It seems that within a week from the start of the project, the accuracy of the algorithms provided by NASA, and obtained in studies started back in 1934 and continued to that time was reached. More than this , within three months from the start of the project, an algorithm was provided by a user, that was more than 300% more accurate than any of the previous versions. The whole case study can be found here.

 essentially, the fun thing about Kaggle is that the winners of the competitions are folks around the world with a knack for problem solving, and not always degrees in mathematics. And degrees don’t matter on Kaggle; all that matters is result. 


Enigma Analytics

Without any introduction we can certainly say that Enigma is a tool that should not be ignored by any data enthusiast. First introduced to the wide public at TechCrunch Disrupt NY 2013 where this start-up was the grand winner, it has gained popularity by simplicity of use and wide availability of its content.

Enigma allows its users to explore a vast amount of publicly available although not easy to obtain data. The service pulls its data from more than 100,000 data sources, a major advantage being a deceptively simple process of sifting through all the information  — a quick search for a person’s name or company brings up multiple detailed sources of information, and jumping in and playing with data is thoughtfully executed. 

By now the excellent simplistic design and usefulness of the information provided in one place has brought the company partnerships with the Harvard Business School, research firm Gerson Lehrman Group, S&P Capital IQ, and newly-minted strategic investor the New York Times.

Although by now it has proven itself a very useful tool Enigma has its ups and downs. The biggest downsize is the fact that it only has databases collected from american government and american local authorities, which is great because those datasets are public and free but they are not very useful for researchers from another countries, unless they are studying their country relations with America. Second of all, its simplistic design can be a bit confusing at first because it’s a new type of application and not all of its functions are clear. However this can be avoided if before browsing through the site you first visit the support section.

All in all , we have reached the verdict that Enigma is a great App if you are interested in public data of America, not easy to obtain otherwise.

Experimentation is a Must

word cloud


This word cloud represents the answer to the question of which areas are you going to be experimenting most heavily in the coming year, given by more than 600 representatives of different online companies.

Experimenting is one of the key tools of marketing engineering, and although the results of test-and-learn approaches are more widely appreciated, establishing the most appropriate culture is what holds most companies back, if we neglect the fear of failure.

Continue reading

What are the most exciting opportunities for companies this year?

Hello everybody. Today I want to share with you a new research conducted by Adobe that we got our hands on these days. It’s actually a perspective view over the digital world and a briefing of what to expect from this field in 2014.If last year was about recognizing the importance of customer experience, this one is about actually doing something. For an optimal customer experience, various business functions and customer-facing touch points need to be working in harmony, from customer service and advertising to online user experience, content management and email messaging. For the question of which one area is the single most exciting opportunity for your organization (or for your client) in 2014 the responses were diverse but following a well defined pattern.

the webWe know the number of company respondents (980) and the one of Agency respondents (1202) and from this we conclude that organizations need to ensure they have the right data, technology and culture to act as the foundation for a great customer experience, with a focus on multichannel marketing and campaign management also required to underpin a successful approach.

The mobile part, the second most exciting opportunity in the eyes of client-side respondents and first on the list for supply-side participants has a well earned position. About this we’ve already written in another post few weeks ago and is no surprise at all.  Despite the importance of mobile and prominence of smartphones and tablets in our lives, many companies are still trying to work out how they optimize their websites for mobile, for example, whether they should go down the ‘responsive’ route or not.

A second figure that i’d like to discuss is not so much about the big picture and more about specific disciplines. The question is which three digital-related areas are the top priorities for your organization (or for your clients) in 2014?

miner

It seems that marketers and digital professionals are clear on what the priorities are, and this has not changed markedly in the last year, knowing that the top five options are in exactly the same order as for last year’s survey, respectively content marketing, social media engagement, targeting and personalization, conversion rate optimization and mobile optimization.