Data Grants from Twitter

There is a lot of fuss these days because of the newest announcement made by Twitter on February 5. They encourage research institutions to apply until March 15 in what seem to be a scientific lottery, for a chance to the access of twitter’s data sets. Around 500 million Tweets are sent out each day and if they were to be scientifically quantified, studies like where the flu may hit,  health-related information or events like ringing in the new year could be analyzed from a statistical point of view and outcomes could be predicted.

Twitter acknowledges the difficulties that researchers have to face when they have to collect data from the platform and therefore it named this project the Twitter Data Grants, aiming for a better connection between research institutions or academics and the data they need. Also, along with the data itself, the company will offer for the selected institutions the possibility of collaboration with their own engineers and researchers, all this, with the help of Gnip one of the most important Twitter’s certified data reseller partner.
How to make your life easier with Google

Ok, maybe the title is a little bit too optimistic, but today I want to talk about one of the many Google products that makes our daily life better.  Everyone uses Google, either for personal matters or for business interest but how many have heard about The Google Prediction API?

This, as the most of their projects, comes to our help, by learning algorithms to analyze your historic data and predict likely future outcomes. It can be very helpful, especially in the case where big amounts of data are to be handled. You can also say that Big Data is not anymore the future, it’s now and you have to know how to take advantage of it.

Among the uses of Prediction API we can mention, separation of certain types of messages, considering the languages that are written in for specific answers, or spam detection, based on comparison to a lists of already marked spam messages. But maybe the most important use case that we can think of is the purchase prediction, the ability to understand the customer’s behavior and to decide whether or not he is going to make a purchase from your e-commerce business.

In the past, this would have been done using a regression model, being very time consuming and quite hard and this is why I believe that Google Prediction API is one of the tools that will make your life easier and increase profit on your internet business.

Facebook tomorrow!

There comes a time in each of our lives when we wonder ourselves either from curiosity or from perspective  what is going to be the next big thing, and because this is a blog dedicated to science we are gonna restrict to this area.

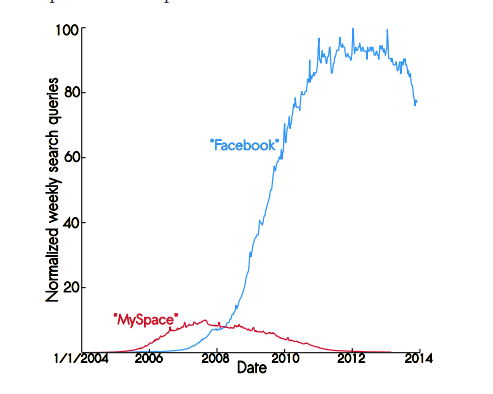
Of course we can’t know what is going to be the technology of tomorrow but we are going to tell you what is not going to be: Facebook!  According to Princeton’s engineers facebook it’s very likely to reach to an end in the next few years. They used for the research an epidemiological model, very similar to Gaussian bell but more complex in the way of describing the transmission of communicable disease through individuals. According to the model chosen, called SIR the total number of population equals the sum of Susceptible plus Infected plus Recovered persons. They chose this pattern because is relevant for phenomena with relative short life span, and after that they applied in the case of MySpace and they noticed that it fit almost perfectly.

9T7Sm6a


We can easily see in this graph that the decline of facebook has already begun but it’s not as near as expected. Actually we can be sure that we will not exterminate it from our lives sooner than 2018 but also, internet can be a very unpredictable place and no one can exactly determine how it’s going to end.

Also we advise you not to take for granted this study because, as we found out, it was conducted by researchers based in the school’s department of mechanical and aerospace engineering. Not saying that they are not professionals but nevertheless not experts in such social studies.


What are you looking at?

When you open a new website, what do you first look at? Do you think is the same thing that i look at, or any other person? You may be tempted to say no, that we are different persons with different interest so we don’t look at the same things but science research tends to disagree with that affirmation.

Recently, more and more companies that study visitors behavior on web sites appeared, and one of them, EyeQuant, also affiliated with Google has just published the results of a study in which 46 subjects were requested to browse over 200 sites. The result came as a surprise, in the benefit of the company because it turns out what people are really interested in. First of all against the popular belief people aren’t that interested in faces or large font writings but rather in small sets of text and instruments that are available on the first page.

Also another interesting idea came out from the analysis of sites that were offering something free. Although economically it’s almost impossible to beat something free, it seems like people are not that interested in big adverts of free stuff.

So, in conclusion here is some important information that you shouldn’t skip if you plan on launching your own internet company. We’re not saying that otherwise you will fail but it’s always better to know your customers a little bit better than they know themselves!

The New Mobile Optimized Web Miner!

We all have to accept the fact that society is changing, and that we have to change too if we want to stay on top of any situation. Nowadays each one of us has a cellphone and many own a smartphone.

Because of the rush that we live in, we always have to be up to date with latest news and to be able to search, browse, compare and analyze websites right on the spot. But what do you do when a site fails to load on a mobile device, or has a very unfriendly look because of the desktop version unable to fit on a mobile screen. Well, i know for sure that lots of you will simply exit that website and search for an alternative mobile friendly solution.

It’s strange to see that companies fail to adapt to society and have their websites optimized for a better experience of the users. As facts, in 2013 the number of mobile devices connected to the internet exceeded the ones of the classic computers, and also, at any instance 30 percent of all internet traffic is generated from a smartphone or a tablet, and this numbers are only going to grow in 2014.

It’s easy to see the pros and cons of a mobile browsing experience and mostly the cons relate to the websites that don’t give useful information in the best way so that it can be received well. A bad mobile experience can even lead to damaging a company’s brand, not mentioning all the loses in the e-commerce branch that can survey for a retailer.

Starting a month ago TheWebMiner has implemented a mobile aware of the site for a better experience of the visitors and hopefully of the future partners. We hope that you will enjoy reading the latest posts of our blog on the go and that it will be much easier for you to find web scraping information for your company!

How website look on tablet

2014-01-12 18_55_37-TheWebMiner is a cloud data mining company

How website look on smartphone

TheWebMiner is a cloud data mining company - Google Chrome_2014-01-12_18-45-43


Guesstimation

Today’s post is about something we’ve been wanting to write for some time. Although it is not related to web scraping it has to do with taking a decision without needing to use a very large number of resources, having proven its efficiency in a number of cases.

Guesstimation, a concept first used in the early 30’s (not quite new as we can see) means exactly the two purposes of the two words of which is made. On the one hand we have the word Guess, denoting a not very accurate way of determining things and on the other the word Estimation, which is the process of finding an approximation which value is used for finding out a series of factors. Altogether, the word regards an estimate made without using adequate or complete information, or, more strongly, as an estimate arrived at by guesswork or conjecture.

Guesstimations in general are a very interesting subject because of the factors that led to the result. Some examples of such rather amusing results given by Sarah Croke and Robin Blume-Kohout from the Perimeter Institute for Theoretical Physics and Robert McNees from Loyola University in Chicago. When asked how much memory would a person need to store a lifetime of events the answer was simply calculated at 1 exobyte on the assumption that the human eye works just as a video camera recording everything that happens around us.

Funny or not, guesstimations began step by step to be a part of our life through rough conclusions based on economy and used by the marketers.

Web Scraping’s 2013 Review – part 2

As promised we came back with the second part of this year’s web scraping review. Today we will focus not only on events of 2013 that regarded web scraping but also Big data and what this year meant for this concept.

First of all, we could not talked about the conferences in which data mining was involved without talking about TED conferences. This year the speakers focused on the power of data analysis to help medicine and to prevent possible crises in third world countries. Regarding data mining, everyone agreed that this is one of the best ways to obtain virtual data.

Also a study by MeriTalk  a government IT networking group, ordered by NetApp showed this year that companies are not prepared to receive the informational revolution. The survey found that state and local IT pros are struggling to keep up with data demands. Just 59% of state and local agencies are analyzing the data they collect and less than half are using it to make strategic decisions. State and local agencies estimate that they have just 46% of the data storage and access, 42% of the computing power, and 35% of the personnel they need to successfully leverage large data sets.

Some economists argue that it is often difficult to estimate the true value of new technologies, and that Big Data may already be delivering benefits that are uncounted in official economic statistics. Cat videos and television programs on Hulu, for example, produce pleasure for Web surfers — so shouldn’t economists find a way to value such intangible activity, whether or not it moves the needle of the gross domestic product?

We will end this article with some numbers about the sumptuous growth of data available on the internet.  There were 30 billion gigabytes of video, e-mails, Web transactions and business-to-business analytics in 2005. The total is expected to reach more than 20 times that figure in 2013, with off-the-charts increases to follow in the years ahead, according to researches conducted by Cisco, so as you can see we have good premises to believe that 2014 will be at least as good as 2013.


Web Scraping’s 2013 Review – part 1

Here we are, almost having ended another year and having the chance to analyze the aspects of the Web scraping market over the last twelve months. First of all i want to underline all the buzzwords on the tech field as published in the Yahoo’s year in review article . According to Yahoo, the most searched items wore

  1. iPhone (including 4, 5, 5s, 5c, and 6)
  2. Samsung (including Galaxy, S4, S3, Note)
  3. Siri
  4. iPad Cases
  5. Snapchat
  6. Google Glass
  7. Apple iPad
  8. BlackBerry Z10
  9. Cloud Computing

It’s easy to see that none of this terms regards in any way with the field of data mining, and they rather focus on the gadgets and apps industry, which is just one of the ways technology can evolve to. Regarding actual data mining industry there were a lot of talks about it in this year’s MIT’s Engaging Data 2013 Conference. One of the speakers Noam Chomsky gave an acid speech relating data extraction and its connection to the Big Data phenomena that is also on everyone’s lips this year. He defined a good way to see if Big Data works by following a series of few simple factors: 1. It’s the analysis, not the raw data, that counts. 2. A picture is worth a thousand words 3. Make a big data portal (Not sure if Facebook is planning on dominating in cloud services some day) 4. Use a hybrid organizational model (We’re asleep already, soon)  let’s move 5. Train employees Other interesting declaration  was given by EETimes saying, “Data science will do more for medicine in the next 10 years than biological science.” which says a lot about the volume of required extracted data.

Because we want to cover as many as possible events about data mining this article will be a two parter, so don’t forget to check our blog tomorrow when the second part of this article will come up!

K-means clustering and why?

You have certainly noticed, even if you are in this business or not, that online marketing has became a science far more complicated than it was a decade ago, and also with a exponential rate of grow. Simply because of the need to keep up with the big corporations, small online companies have become more and more interested into the simple ways of maximizing the profits. One of these ways is to use K-means clustering.

Through this, one can discover hot words that led viewers to its webpage or to analyze the behavior of people browsing through pages of a site. Many other possibilities are available for the K-means but these two are the two most common used in online marketing industry.

The term of K-means refers to the number of average values that can be associated with a certain data domain.. when used with text , k-means can provide a very good way to organize the millions of words used by the customers to describe their visits and so, for marketers to actually determine what the users meant and felt at that certain time.

Once someone did understand what his clients are trying to do, he can adapt on the individual needs of users and suggest new ways that can bring more and more income without neglecting the obviously improvement of his services.


Average photo or photo mean

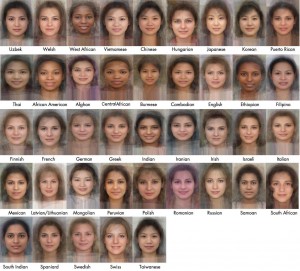
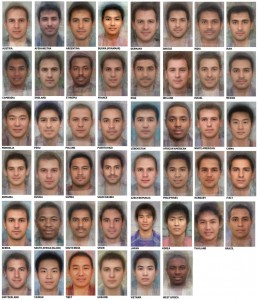
A couple of days ago I saw on the internet some photo statistics with average man and average woman from different regions around a world.

The average women face around the world

the_average_womans_face_around_the_world

The average mens face around the world

the_average_mens_face_around_the_world

An interesting question it’s How are made?

There are made using many layers of photos with opacity (alpha value). This means if we want to do mean of 3 photos we need to put 3 overlapping photos with 33% opacity for each. In many cases we can’t obtain a very sharp image. For example above photo results are photoshoped after overlapping.